Positive Health Online
Your Country

![[Image: https://www.water-for-health.co.uk/]](/img/original/BannerAvatar/4046.12831f50177f8848ee87b8e94411d6b3.jpg "https://www.water-for-health.co.uk/")
![[Image: http://www.abundanceandhealth.co.uk]](/img/original/BannerAvatar/2836.df7d2315253110ff5b3a566f94871f99.jpg "http://www.abundanceandhealth.co.uk")
![[Image: https://peacegifts.shop/]](/img/original/BannerAvatar/3906.e1d1ebc07ce7530bbb3d6cf426966b6f.jpg "https://peacegifts.shop/")
![[Image: http://www.balens.co.uk]](/img/original/BannerAvatar/2148.50367fa908013fae0a7f1a171543ef92.jpg "http://www.balens.co.uk")
![[Image: http://www.drsgoodman.com/books-goodman/52-nutrition-and-cancer]](/img/original/BannerAvatar/1859.1296090fd8385e7ceff51c8011559097.jpg "http://www.drsgoodman.com/books-goodman/52-nutrition-and-cancer")
![[Image: IFPA Int'l Fed Aromatherapists]](/img/original/TopicbannerAvatar/1185.9b7a831d484259621c55f48bd9933c3a.jpg "IFPA Int'l Fed Aromatherapists")
![[Image: ISNS International Science and Nutrition]](/img/original/TopicbannerAvatar/4310.3fe1bd582f0b1b36c39fca00e3464581.jpg "ISNS International Science and Nutrition")
![[Image: Balens Specialist Insurance Brokers for Health & Wellbeing Professionals & Organizations]](/img/original/TopicbannerAvatar/3122.5661db4ab5e5bfd5fce3465edaa5662c.jpg "Balens Specialist Insurance Brokers for Health & Wellbeing Professionals & Organizations")
![[Image: SG Cancer Book]](/img/original/TopicbannerAvatar/960.4f24bbd158abe4427cc06911969143e5.jpg "SG Cancer Book")
![[Image: Organic Aromatherapy]](/img/original/TopicbannerAvatar/1001.12a011c5d14492e86a5a2fa985244b74.jpg "Organic Aromatherapy")
Environment Induced Volatility and Cycles in Population Health
listed in clinical practice, originally published in issue 194 - May 2012
All organisms respond to their (changing) environment using a variety of homeostatic mechanisms to maintain vital functions within acceptable limits. The ‘environment’ is the combined and interactive effects of changes in the weather, air quality, infectious outbreaks, etc. By definition, poor health represents the progression of vital functions toward the boundaries of the acceptable physiological and biochemical limits, and should reflect in a degree of environmental sensitivity. While admission to hospital represents the extreme of a continuum of poor health, the fact that all admissions have a recorded diagnosis therefore provides the opportunity to study the sensitivity of a wide range of conditions to the environment.
Figure 1:
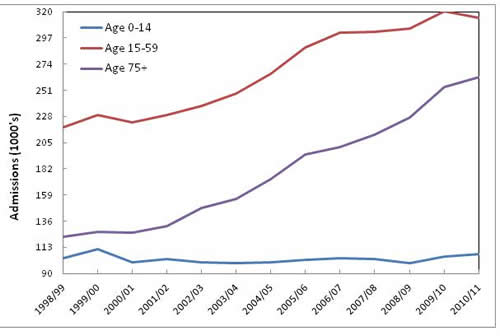
Footnote: Data for hospital admission for accident & injury (International Classification of Disease (ICD) diagnosis codes S00 to T35) in England is from www.hesonline.nhs.uk/Ease/servlet/ContentServer?siteID=1937&categoryID=202
To illustrate this point Figure 1 shows the total admissions for all types of accident and injury in England from 1998/99 to 2010/11 for a number of age groups. Diagnoses for accident and injury have been grouped together for the simple reason that they all tend to rise and fall together. As can be seen, the lines for the different age groups show an erratic trend over time, and with the 0-14 age group showing what appears to be the least erratic behaviour. Erratic changes in the total number of admissions can arise from statistical variation around an average plus additional variation due to the environment.[1] A branch of statistics called Poisson statistics, which describes the variation associated with whole number events such as ambulance call outs per hour, GP referrals per week, etc can be used to test if the observed variation is merely statistical (random variation) or has an additional environmental component.[2]
Table 1: Deviation from the average for injury in children
| Year | Deviation |
|
1998/99 1999/00 2000/01 2001/02 2002/03 2003/04 2004/05 2005/06 2006/07 2007/08 2008/09 2009/10 2010/11 |
2.0 27.6 -10.1 1.0 -9.1 -10.4 -8.2 -3.2 1.2 -0.7 -10.4 7.3 12.8 |
Footnote: The deviation from the average has been expressed in terms of standard deviations worth of difference from the average.
Table 1 takes the line for children (0-15) in Figure 1 and converts the number of admissions in each year into the number of standard deviations away from the average of 102,721 admissions per year. The standard deviation is a measure of how tightly all the data are clustered around the average. Random variation can account for anything up to ± 3 standard deviations away from the average and 9 out of 13 years are well outside these limits, hence, accidents and injury in children can be said to be highly environment sensitive. This has been confirmed by numerous studies investigating the influence of the weather on trauma admissions and attendance at the accident and emergency department.[3-7]
Figure 2: Volatility associated with emergency admissions in New Zealand
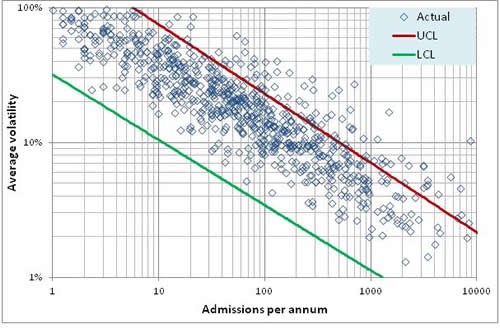
Footnote: Data was kindly provided by the New Zealand Ministry for Health and covers emergency admissions for adults aged over 19 years and excludes maternity and childbirth. Admissions with a very short stay have been excluded. All diagnoses are in ICD version 9 in order to span the time period. Volatility has been calculated as the absolute value of the paired differences in admissions divided by the average of the pair. The average of volatility was calculated and average growth has been subtracted to give the growth adjusted average volatility. In some diagnoses there is a discontinuity in the trend and these values have been excluded from the calculated averages. The LCL and UCL were determined using Monte Carlo simulation.
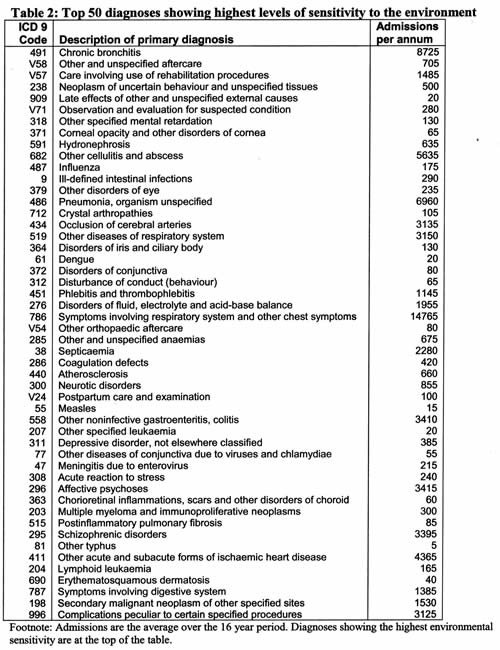
Having demonstrated the process for detecting conditions which may be environment sensitive, Figure 2 gives an analysis of the year-to-year volatility (after adjusting for growth) in hospital emergency admissions for over 800 diagnoses in New Zealand over a 16 year period. The upper and lower control limits (UCL and LCL) are set by Poisson randomness and the method used to determine average volatility is conservative, hence we can conclude that a minimum of 94 out of 800 diagnoses (12%) which account for 40% of admissions show strong environmental sensitivity. The conservative nature of the method can be seen in the fact that the diagnoses within the UCL and LCL tend to be clustered toward the UCL, and hence in reality a higher proportion may in reality be environment sensitive. Table 2 gives a list of the diagnoses showing the very highest levels of environmental sensitivity (accidents and injury excluded), and as can be seen, this list comprises various infectious outbreaks, inflammatory disorders (due to immune imbalances such as inflammatory cytokines, etc), mental health conditions, cancers and a range of diagnoses indicative of post-operative complications, infection or inflammation (other aftercare, etc). The list is entirely sensible in that the fundamental medical association is feasible and has often been documented for individual diagnoses in other research studies.[8-13] Indeed almost all the diagnoses could be said to have a common immune linkage, and in this respect linkages between the environment, the immune system and mental health are becoming increasingly recognised.[14]
Having established that a significant proportion of conditions (primary diagnosis) are sensitive to the combined and interactive effects of the environment, we now need to consider if this sensitivity could lead to the trends in poor health which give rise to long term cycles, i.e. the health state of the population undulates over time. The existence of such cycles has been recently proposed to account for periods of very high hospital bed occupancy and health care cost pressures occurring in Australia, Austria, Canada, Estonia, USA, UK, Ireland, Switzerland.[15-26]
Figure 3: Trend in admissions in New Zealand
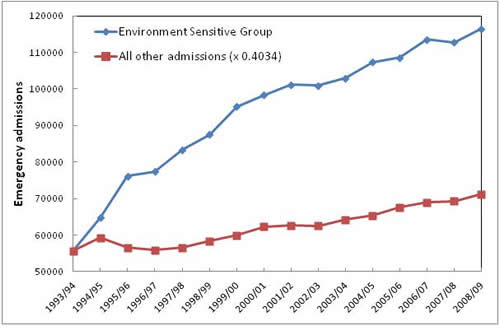
To illustrate this possibility, the trend over time for the environment-sensitive and other diagnoses in New Zealand is displayed in Figure 3. The total of the ‘other’ diagnoses has been adjusted down so that the respective growth over time can be compared. The significant features from Figure 3 are the very high growth in admissions for the environment-sensitive diagnoses (approximately 3.2% p.a. compared to 1.5% p.a. for the other diagnoses), i.e. they are driving the increase in health care costs, and a degree of undulating or cycle-like behaviour (which is also seen to a far lesser degree in the other group). Recall that the process for determining volatility over time involved adjusting for growth, i.e. the volatility is independent of any growth. The list of high growth and environment-sensitive diagnoses given in Table 2 is surprisingly similar to a list identified in England[16-19] and for diagnoses showing high growth in costs in the USA.[27]
The author’s first exposure to the cycle which appears to be associated with medical environment-sensitive admissions was at the Royal Berkshire Hospital (Reading, England). Around the second week of March of 1993, emergency medical admissions (and cost) suddenly rose by around 10% and subsequently stayed high for several years.[16, 28] This curious behaviour was repeated at hospitals across all of England and a number of reports seeking to investigate the causes were published (see references in Jones.[29]. Unfortunately all these reports looked at the trend in annual total admissions, and in doing so missed the unique point where the change had occurred. This fundamental omission led to the incorrect conclusion that there was something wrong with the processes of delivering health care and has in my opinion led politicians to implement needless structural NHS reforms in an attempt to solve this perceived problem.[26] Hence, while ongoing improvement in health care efficiency and processes is always required, (as it is in any other business), repeated attempts at ‘new’ reform may not be the best way to achieve this goal especially if the fundamental causes for the growth in costs lie elsewhere.
In England, the current health service ‘reforms’ will put GPs in charge of most NHS resources and will be commissioning (purchasing) healthcare for their patients. Whilst some can argue that GPs are well placed to do this, after all, collectively they see more than 1 million people per day, this may underestimate the level of expertise needed to do this job well. Furthermore, under the “localism” agenda, GPs have been encouraged to form commissioning groups, called clinical commissioning groups (CCGs) based on small clusters of GP practices. This is a totally inappropriate application of “localism” since it loses economies of scale and exposes each CCG to unacceptably high levels of financial risk which arise from the inherent volatility and growth in costs due to the environment sensitive diagnoses.[2,26] This could then lead GPs into an ethical dilemma with decisions dictated by local volatility in costs. Indeed is this ‘reform’ an attempt to solve the wrong problem? Could the correct solution be to understand why the environment sensitive diagnoses are showing such high growth in admissions and costs and solve the cause rather than the symptoms?
In conclusion, growth in health care admissions and costs is driven by a group of environment-sensitive conditions (with a possible common immune function linkage) which also show evidence for cyclic behaviour. Several hypotheses have been proposed to account for this behaviour,[16-18, 25]; however, considerable additional research will be required to fully understand these factors.
References
1. Jones R. Financial and operational risk in healthcare provision and commissioning. Healthcare Analysis & Forecasting, Camberley, UK. 2006. www.hcaf.biz/Capacity%20Management/Microsoft%20Word%20-%20Variation%20in%20healthcare.pdf [Accessed 5/2/2012].
2. Jones R. The actuarial basis for financial risk in practice-based commissioning and implications to managing budgets. Primary Health Care Research & Development 10(3): 245-253. 2009.
3. Stomp W, et al. Relation of the weather and lunar cycle with the incidence of trauma in the Groningen region. J Trauma 67(5): 1103-1108. 2009.
4. Sun Y, et al. Forecasting daily attendance at an emergency department to aid resource planning. BMC Emerg Med 9(1). 2009. www.biomedcentral.com/content/pdf/1471-227X-9-1.pdf [Accessed 4/2/2012].
5. Parsons N, et al. Modelling the effects of the weather on admissions to UK trauma units: A cross sectional study. Emergency Medicine Journal 28: 851-855. 2011.
6. Rusticucci M, et al. Association between weather conditions and the number of patients at the emergency room of an argentine hospital. International Journal of Biometrology 46(1): 42-45. 2002.
7. Rising W, et al. Correlating weather and trauma admissions at a level 1 trauma centre. J Trauma-Injury Infection & Critical Care 60(5): 1006-1100. 2006.
8. Anderson W, et al. Asthma admissions and thunderstorms: a study of pollen, fungal spores, rainfall and ozone. Q J Med 94: 429-433. 2001.
9. Baldi M, et al. Winter hospital admissions and weather types in the Auckland region. Australian Government Bureau of Metrology. 2009. www.bom.gov.au/events/9ichsmo/manuscripts/M1415_Baldi.pdf
10. Danet S, et al. Unhealthy effects of atmospheric temperature and pressure on the occurrence of myocardial infarction and coronary deaths. Circulation 100: e1-e7. 1999.
11. Dawson J, et al. Associations between metrological variables and acute stroke hospital admissions in the west of Scotland. Acta Neurologica Scand 117(2): 85-89. 2007.
12. Diaz J, et al. A model forecasting emergency hospital admissions: Effect of environmental variables. Journal of Environmental Health 64: 9-15. 2001.
13. Hughes S, et al. Weather forecasting as a public health tool. Centre for Public Health, John Moores Universtity, Liverpool, UK. 2004. www.cph.org.uk/showPublication.aspx?pubid=151 [Accessed 5/2/2012]
14. Dantzer R, O’Connor J, Freund G, Johnson R, Kelly K. From inflammation to sickness and depression: when the immune system subjugates the brain. Nature Rev Neuroscience 9: 46-57. 2008.
15. Jones R. Cycles in emergency admissions. British Journal of Healthcare Management 15(5): 239-246. 2009.
16. Jones R. Unexpected, periodic and permanent increase in medical inpatient care: man-made or new disease. Medical Hypotheses 74: 978-83. 2010.
17. Jones R. Can time-related patterns in diagnosis for hospital admission help identify common root causes for disease expression? Medical Hypotheses 75: 148-154. 2010.
18. Jones R. The case for recurring outbreaks of a new type of infectious disease across all parts of the United Kingdom. Medical Hypotheses 75(5): 452-457. 2010.
19. Jones R. Emergency preparedness. British Journal of Healthcare Management 16(2): 94-95.2010.
20. Jones R. Emergency admissions and financial risk. British Journal of Healthcare Management 15(7): 344-350. 2009.
21. Jones R. Forecasting demand. British Journal of Healthcare Management 16(8): 392-393. 2010.
22. Jones R. Nature of health care costs and financial risk in commissioning. British Journal of Healthcare Management 16(9): 424-430. 2010.
23. Jones R. Trends in programme budget expenditure. British Journal of Healthcare Management 16(11): 518-526. 2010.
24. Jones R. Forecasting emergency department attendances. British Journal of Healthcare Management 16(10): 495-496. 2010.
25. Jones R. Could cytomegalovirus be causing widespread outbreaks of chronic poor health? in Shoja M, et al. Hypotheses in Clinical Medicine. Nova Science Publishers Inc. New York. In press. 2012.
26. Jones R. Time to re-evaluate financial risk in GP commissioning. British Journal of Healthcare Management 17(1): 39-48. 2012.
27. Stranges E, et al. Components of Growth in Inpatient Hospital Costs, 1997–2009. HCUP Statistical Brief #123. Agency for Healthcare Research and Quality, Rockville, MD. November 2011. www.hcup-us.ahrq.gov/reports/statbriefs/sb123.pdf
28. Jones R. Emergency admissions: Admissions of difficulty. Health Service Journal 107(5546): 28-31. 1997.
29. Jones R. Bed occupancy – the impact on hospital planning. British Journal of Healthcare Management 17(7): 307-313. 2011.
Comments:
-
No Article Comments available